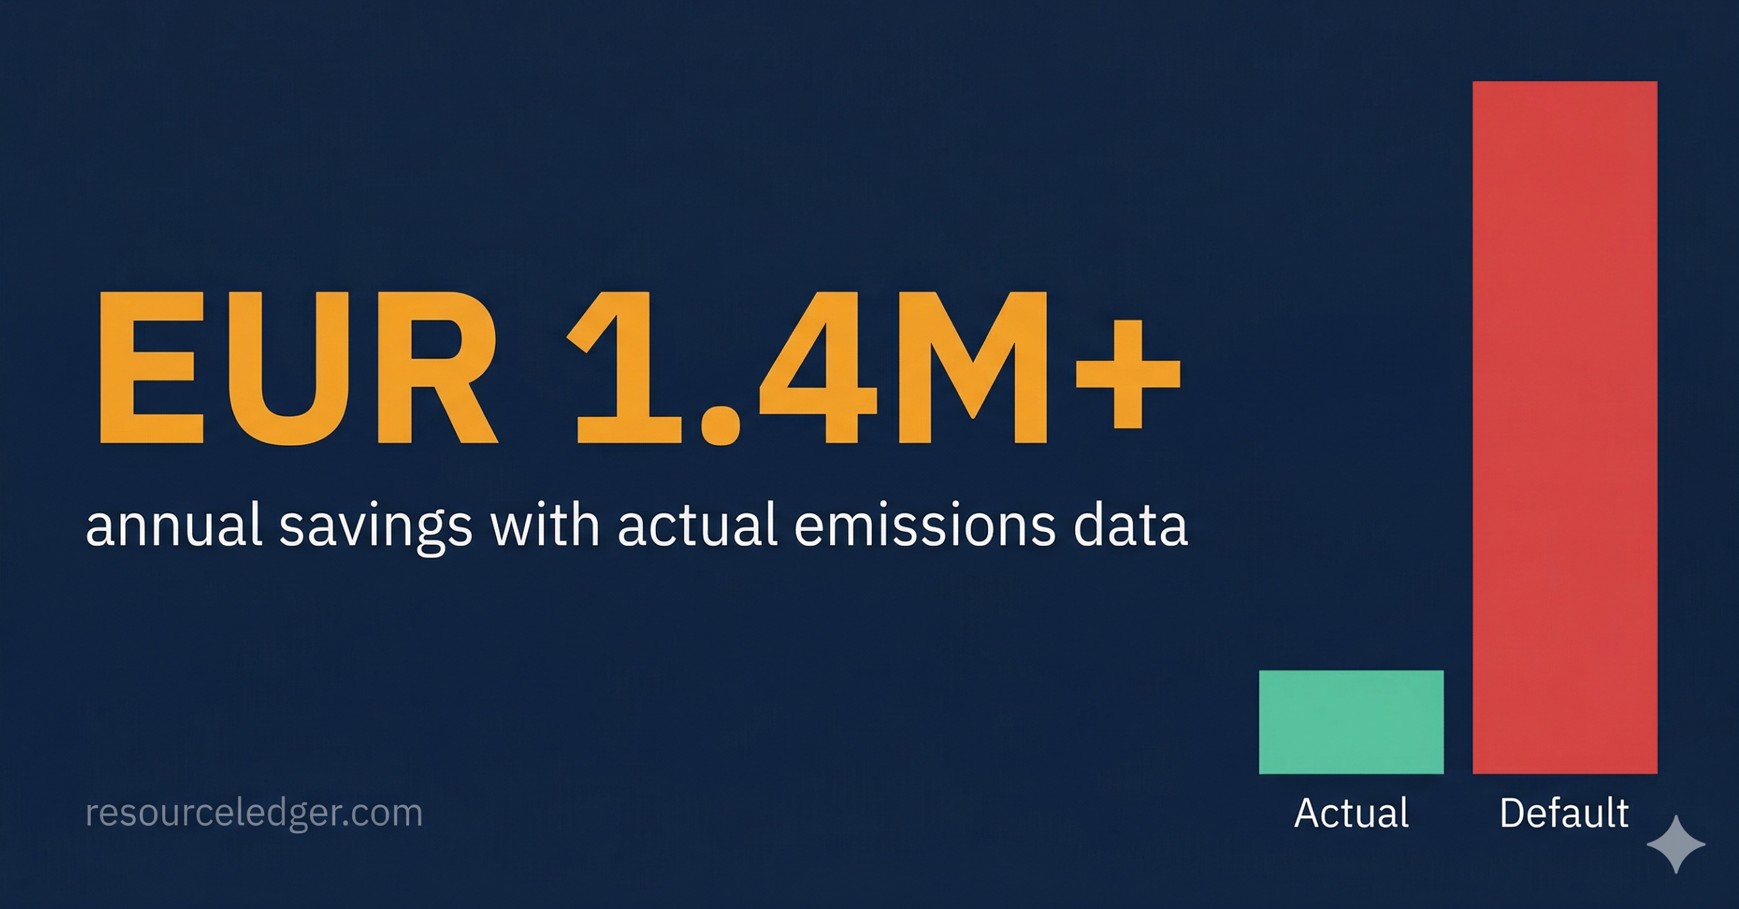
A single mid-sized steel exporter stands to save more than EUR 1.4 million (~53 million baht) per year by submitting actual emissions data under the EU's Carbon Border Adjustment Mechanism, instead of accepting default values that overstate their carbon intensity by up to seven times.
Across Asia-Pacific steel supply chains, CBAM reshapes which countries can compete profitably in the European market. The answer depends on one thing: how your steel is made.
What Is CBAM? (The 60-Second Version)
Starting 1 January 2026, EU importers of steel, aluminium, cement, and other carbon-intensive goods must purchase CBAM certificates based on the embedded carbon in those imports. The certificate price tracks the EU Emissions Trading System (EU ETS), the EU's carbon market where European industrial emitters already pay for their CO2, currently EUR 70-100 per tonne. CBAM extends that carbon price to imports. The cost lands on importers, who pass it back (in full or in part) through price negotiations.
The phase-in is gradual: 2.5% of certificates in 2026, rising to 100% by 2034. The direct cost today is small, but EU procurement teams are already factoring in the full trajectory.
Progressively priced out
2.05
tCO₂/t~90% blast furnace
No ETS carbon price offset
Winners and losers within
2.55
tCO₂/t avg65% BF-BOF + coal-DRI
18% of global CBAM cost
Clean — if they prove it
0.3–0.5
tCO₂/t directScrap-fed EAF
Default penalty: 4–7×
Bars scaled to 3.8 tCO₂/t. Sources: worldsteel, IEEFA, SteelOnTheNet, IR 2025/2621.
Three Countries, Three Very Different Outcomes
China: The Challenged Giant
China produces ~90% of its steel via blast furnace-basic oxygen furnace (BF-BOF), the most carbon-intensive route, at around 2.0-2.1 tCO2 per tonne. Chinese steel's share of EU imports grew 31% year-on-year through 2025, and at full phase-in, BF-BOF steel faces ~EUR 170-180 per tonne in embedded carbon costs. China's own ETS does not yet cover steel, so no origin carbon price offsets the CBAM bill.
China is investing in scrap-EAF and hydrogen steelmaking, but the transition is slow: the existing blast furnace fleet averages just 13 years old. Carboneer found that Chinese producers submitting actual data reduce CBAM costs by ~62% versus defaults. The incentive to act is real, even for high emitters.
Bottom line: Chinese steel becomes progressively more expensive in Europe through 2034, opening the door for cleaner producers to win the procurement decisions being made today.
India: The Costly Transition
India's steel industry presents the most complex CBAM picture. Roughly 65% of output comes from BF-BOF, with significant volumes from electric arc furnaces and induction furnaces fed by coal-based direct-reduced iron (DRI). Unlike the Middle East, where DRI uses natural gas, India's DRI predominantly uses coal, pushing average emissions to ~2.55 tCO2/t (worldsteel, IEEFA), 20-25% higher than China's despite India having more electric steelmaking capacity.
India is expected to bear 18% of total global CBAM costs, nearly double its share of EU import value. Carboneer's research shows Indian producers using actual data reduce CBAM costs by ~32% versus defaults, a smaller saving than China's 62% because some Indian production routes actually exceed the default values.
Bottom line: CBAM splits Indian steel into winners and losers. Scrap-EAF producers are well-positioned; BF-BOF and coal-DRI producers face significant exposure. The national average masks enormous variation between mills.
Thailand: The Quiet Advantage
Thailand's steel industry is structurally different: overwhelmingly EAF-based with no large-scale integrated blast furnace capacity, and predominantly scrap-fed. The country is also actively phasing out lower-quality induction furnace (IF) production, with the Industry Ministry moving to revoke IF steel certification on quality and environmental grounds. Direct emissions for a typical scrap-fed EAF mill producing hot-rolled product fall in the range of 0.3-0.5 tCO2 per tonne (SteelOnTheNet; worldsteel). Including grid electricity (Thailand's grid factor is 0.475 tCO2e/MWh), the total reaches ~0.6-0.9 tCO2/t, dramatically below Chinese and Indian averages.
Thailand is not a major EU steel exporter today. Direct steel exports to the EU totalled roughly USD 95 million in 2024, up 55% year-on-year but still a fraction of Thailand's overall steel output. But direct steel exports are not the full picture: the bigger CBAM exposure comes from downstream manufactured goods, as we discuss below. Thailand's Climate Change Act (cabinet-approved December 2025) adds a domestic policy tailwind.
Bottom line: Thailand has the production profile to benefit from CBAM. The question is whether Thai exporters, and the manufacturers who buy their steel, will prepare the emissions data to prove it.
The Default Value Trap
There's a catch that punishes the cleanest producers the most.
If an exporter doesn't submit verified actual emissions data, the EU applies default values. From 2026 onward (IR 2025/2621), these are country-specific and product-specific, calculated from national production data plus a deliberate markup of 10-30%, designed to incentivise exporters toward actual reporting.
For Thailand's hot-rolled flat steel (CN 7208), the 2026 default is 2.11 tCO2e/t (base 1.92 + 10% markup, rising to +30% by 2028). A Thai scrap-EAF mill at 0.3-0.5 tCO2/t is assigned a default 4-7 times its actual intensity.
The CBAM benchmarks compound the problem. The free allocation credit varies by production route:
- Scrap/EAF: 0.072 tCO2e/t
- DRI/EAF: 0.481 tCO2e/t
- BF-BOF: 1.370 tCO2e/t
A 19-fold difference. Exporters using defaults may be benchmarked against a dirtier route than the one actually used.
| Country | Typical Route | Actual Emissions (approx.) | Default vs Actual Gap |
|---|---|---|---|
| China | BF-BOF | ~2.0-2.1 tCO2/t | Small: default likely close to actual BF-BOF levels |
| India (BF-BOF/DRI) | BF-BOF / Coal-DRI | ~2.5-3.8 tCO2/t | May benefit from defaults (actual can exceed default) |
| India (Scrap-EAF) | Scrap-EAF | ~1.1-1.3 tCO2/t | Significant: clean Indian EAF penalized by national average |
| Thailand | Scrap-EAF | ~0.3-0.5 direct / ~0.6-0.9 total | Massive: 4-7x overpayment on direct emissions |
The cleanest producers are the most punished by the default system. Thai EAF faces up to a 7x penalty; Chinese BF-BOF, almost none. The EU designed it this way to push exporters toward actual data.
What It Costs to Do Nothing
Consider a Thai exporter shipping 12,000 tonnes of hot-rolled coil per year to the EU. Using 2026 Commission-verified values and CBAM benchmarks for CN 72083700, with an illustrative direct emissions figure of 0.36 tCO2e/t (low end of the EAF range):
- Actual data (0.36 tCO2e/t): ~3,805 certificates/year
- Defaults (2.11 tCO2e/t): ~24,495 certificates/year, more than six times as many
These figures use the 2026 free allocation adjustment. At full phase-in (2034), the benchmark deduction drops to zero and the gap widens further. Even at 0.50 tCO2e/t (high end of the EAF range), actual-data certificates come to ~5,485/year, still less than a quarter of the default case.
At EUR 85/tCO2, savings range from EUR 1.4 million (~53 million baht) to EUR 1.76 million (~67 million baht) per year depending on the mill's actual intensity, and the gap only grows as free allocation phases out through 2034. EU buyers are already making supplier decisions based on where these costs will be in 2030 and beyond.
12,000t/yr Thai hot-rolled coil at EUR 85/tCO₂ (current ETS range)
At 0.50 tCO₂/t (high end of EAF range), savings still exceed €1.4M (~53M baht) at €85. Uses 2026 free allocation adjustment — gap widens at full phase-in (2034). EUR/THB ≈38. Source: IR 2025/2620, IR 2025/2621, SteelOnTheNet.
The Timeline
- 1 Jan 2026: Definitive period begins. Certificates must be purchased.
- Calendar year 2026: The emissions data covered by your first declaration.
- 30 Sep 2027: First CBAM declaration due.
- 2028-2033: Certificate surrender escalates (10% → 22.5% → 48.5% → 61% → 73.5% → 86%).
- 2028: CBAM extends to ~180 downstream steel and aluminium products.
- 2034: Full phase-in, 100% surrender.
The preparation window isn't "before 2027." It's now.
Definitive period begins — certificates must be purchased
2.5% surrender. Calendar year 2026 data feeds first declaration.
First CBAM declaration due — 30 September
CBAM extends to ~180 downstream products
Vehicle parts, machinery, appliances, construction equipment.
Certificate surrender escalates: 10% → 86%
Free allocation shrinks every year.
Full phase-in — 100% surrender
No free allocation. Full embedded carbon cost on every tonne.
The preparation window isn’t “before 2027” — it’s now. EU procurement teams are already factoring in the full trajectory.
What Exporters Should Do Now
- Know your default number. Look up your CN codes in the Commission's default values workbook. That's what you'll pay if you do nothing.
- Collect installation-level data for 2026. Energy by source, raw materials, production volumes, process emissions. This is what closes the gap between your default and your actual.
- Confirm your benchmark route. The difference between being classified as scrap-EAF (0.072) and BF-BOF (1.370) is 19x. Make sure your verifier assigns the right one.
- Engage a verifier now. Accredited capacity will tighten as September 2027 approaches.
Why This Matters Beyond Steel Mills
Thailand's direct steel exports to the EU are modest, roughly USD 95 million in 2024. A Thai mill could reasonably decide to sell to ASEAN or the US instead and avoid CBAM entirely. But that calculation changes in 2028.
The Commission has proposed extending CBAM to approximately 180 downstream products with high steel and aluminium content: vehicle parts, chassis, gear boxes, suspension systems, appliances, machinery, and construction equipment. Thailand exports EUR 27 billion in goods to the EU annually, led by machinery and appliances. When those products carry embedded steel emissions, the carbon intensity of the steel input becomes a cost line in every EU-bound shipment.
A Thai auto parts manufacturer sourcing from local scrap-EAF mills will have a structurally lower CBAM bill than a competitor sourcing from Chinese BF-BOF supply chains, across every product line, every year, compounding through 2034. Kasikorn Research Centre estimates the total CBAM impact at 3.8% of Thailand's exports to the EU, or roughly 28 billion baht, and the bulk of that will come from downstream manufactured goods, not raw steel.
The steel mill's emissions data becomes the manufacturer's competitive advantage. And the manufacturers who can demonstrate verified low-carbon steel inputs will be the ones EU buyers prefer, not because of green branding, but because it's cheaper.
Thailand’s CBAM exposure is about to get much bigger
The steel mill’s emissions data becomes the manufacturer’s competitive advantage. Source from scrap-EAF, pay less CBAM — across every product line exported to Europe.
Source: EU DG Trade (€27B), KResearch (3.8%). EUR conversions approximate.
Find Out Your Number
Every exporter's gap is different. It depends on your CN codes, production route, and actual emissions intensity. Here is what we suggest:
- Email us your CN codes and production route. We will walk you through your specific default-versus-actual gap and what it means in EUR and baht.
- We will show you the calculation: the same methodology used in this article, applied to your products and volumes.
- You decide what to do next: whether that means engaging a verifier, adjusting your sourcing, or starting installation-level data collection for your first CBAM declaration in September 2027.
Your first declaration deadline is 30 September 2027. The data it covers is being generated now, calendar year 2026. Waiting until Q3 2027 to start means reporting on a year of emissions you never measured.
Contact: roger@resourceledger.com | resourceledger.com
Sources
This article uses publicly available data as of March 2026. Key sources:
EU regulatory sources:
- Implementing Regulation (EU) 2025/2620: CBAM benchmarks and free allocation adjustment (OJ L 2025/2620, 22 Dec 2025)
- Implementing Regulation (EU) 2025/2621: Country-specific default values for 132 countries (22 Dec 2025)
- Directive (EU) 2023/959: ETS amendments including the CBAM phase-in schedule
- European Commission CBAM benchmarks workbook (published 6 February 2026)
- European Commission default values workbook (published 4 February 2026)
- European Commission proposal to extend CBAM to downstream steel and aluminium products (target: January 2028)
Industry and market sources:
- Carboneer: CBAM impact analysis on Chinese and Indian steel imports (2024)
- SteelOnTheNet: EAF steelmaking CO2 emissions data (direct emissions 0.06-0.10 tCO2/t for typical scrap-EAF)
- Thailand Greenhouse Gas Management Organization (TGO): grid emission factor
- Thai trade statistics: steel export volumes to EU
- worldsteel Association: production route statistics by country
- Kasikorn Research Centre: CBAM impact estimate for Thailand (28 billion baht / 3.8% of EU exports)
- Iron and Steel Institute of Thailand (ISIT): industry structure and EAF capacity data
- Federation of Thai Industries (FTI), Steel Industry Group: CBAM preparedness commentary
- Fastmarkets: green steel premiums and CBAM cost impact analysis
- S&P Global: CBAM definitive period market analysis (January 2026)
Readers should consult the latest Commission publications for country-specific default values applicable to their products. Cost scenarios assume full CBAM phase-in (2034) and are illustrative. Actual costs depend on product, production route, certificate price at time of purchase, and the specific default value assigned under IR 2025/2621.